Did We Just Experience A Flash Crash?
Typically, when trying to learn about the stock market I’ll use examples from the past to try and give us an idea of how markets work and what we might expect in the future. It’s valuable to use past data because it allows us to see how trends play out in the long run.
However, sometimes we don’t need to go back and study past decades to learn how markets work. Sometimes, there are lessons we can learn based on what’s happening in the stock market right now.
Let’s use what’s happened over the past couple of weeks as an example.
At the end of July, I wrote an article where I painted a rosy picture of the U.S. stock market’s smooth upward trajectory in 2024. I shared the following:
“Not only has the market surged, but the ride has been about as smooth as it can be. As I’m writing this, there has only been one day in 2024 when the market has moved more than 2% up or down; that was back in February when it gained 2.1%.”
Predictably, immediately after that article was published the S&P 500 started to slide downward. Exactly one week later on Monday, August 5th, the S&P 500 opened down 4%—the biggest single-day decline since September of 2022.
This marked a total decline of around 8.5% from the all-time highs back in the middle of July.
Everything was going swimmingly, then seemingly out of nowhere people’s worries about a recession, an AI bubble, inflation, interest rates remaining high, and the upcoming election all bubbled to the surface and there was quite a panic online that Monday.
Personally, I was a bit perplexed by all of the mania online and the media causing an alarm. But I guess I shouldn’t be, the goal of most online discourse is to drive engagement, and engagement soars when negativity and fear are spread.
It’s natural to feel anxious and nervous about stock market declines, but from a pure numbers standpoint, what happened a few Mondays ago isn’t very newsworthy at all.
Going back to 1928, 94% of all years have a drawdown of at least 5%:
I’ll repeat that. The U.S. stock market declines at least 5% pretty much every single year.
Not to mention, that even at its lowest point, the S&P 500 was still up over 9% on the year.
Now, what has happened in the weeks since that dip?
After the low on August 5th, the market gained all of those losses back in just four days. The market gained nearly 9% in a little over two weeks.
This is the issue with getting sucked up in online discussions about the stock market and trying to perfectly time when to get in and out of the market. If you had taken all of your money out of the stock market that Monday due to fears about further declines, you would have missed out on a huge two-week return.
And missing out on the past two weeks can drastically impact your overall investment performance.
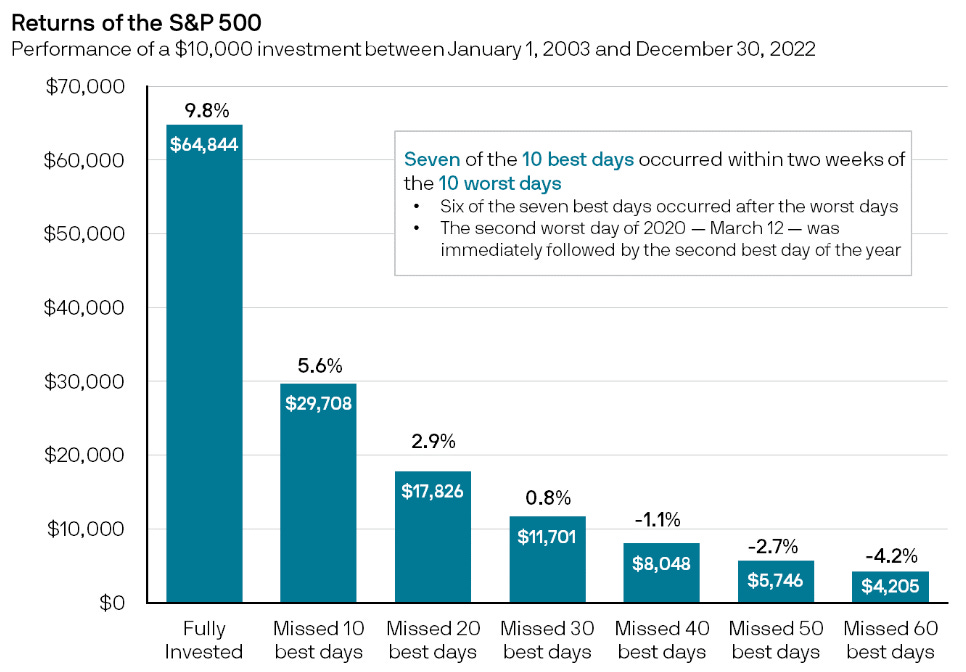
The following graph from J.P. Morgan illustrates this point:
During a 20-year timeframe, there are about 5,060 trading days. If you missed out on only 40 of the best-performing days you would have received a negative total return over that span. You can go from multiplying your money by six to having much less than you started with by just missing 40 days out of 5,060.
You may be thinking, “Yeah, but isn’t it relatively easy to not miss the best days? If I’m cashing out when the stock market is crashing, how likely am I to miss out on one of those best days?”
Well, as the past couple of weeks have shown, it’s pretty likely. Volatility tends to cluster — meaning the best days in the market are often concentrated around the worst days in the market.
The majority of your investment returns are built on just a few good days or weeks of market performance. The only way to guarantee that you’ll be able to take advantage of the best days is to stay invested and stick around during the worst days.
Peter Lynch (legendary investor) once said:
“Far more money has been lost by investors preparing for corrections or trying to anticipate corrections than has been lost in corrections themselves.”
Thanks for reading!


